Enhancing Urban Mobility through Next-Gen Traffic Management Software
CONTEXT
Transforming the intelligent traffic management idea to SaaS experience
MY ROLE
Lead UX UI Designer
TEAM
3 UX UI Designers
4 Developers
1 Product Manager
TIMELINE
Nov 2022 - Apr 2023
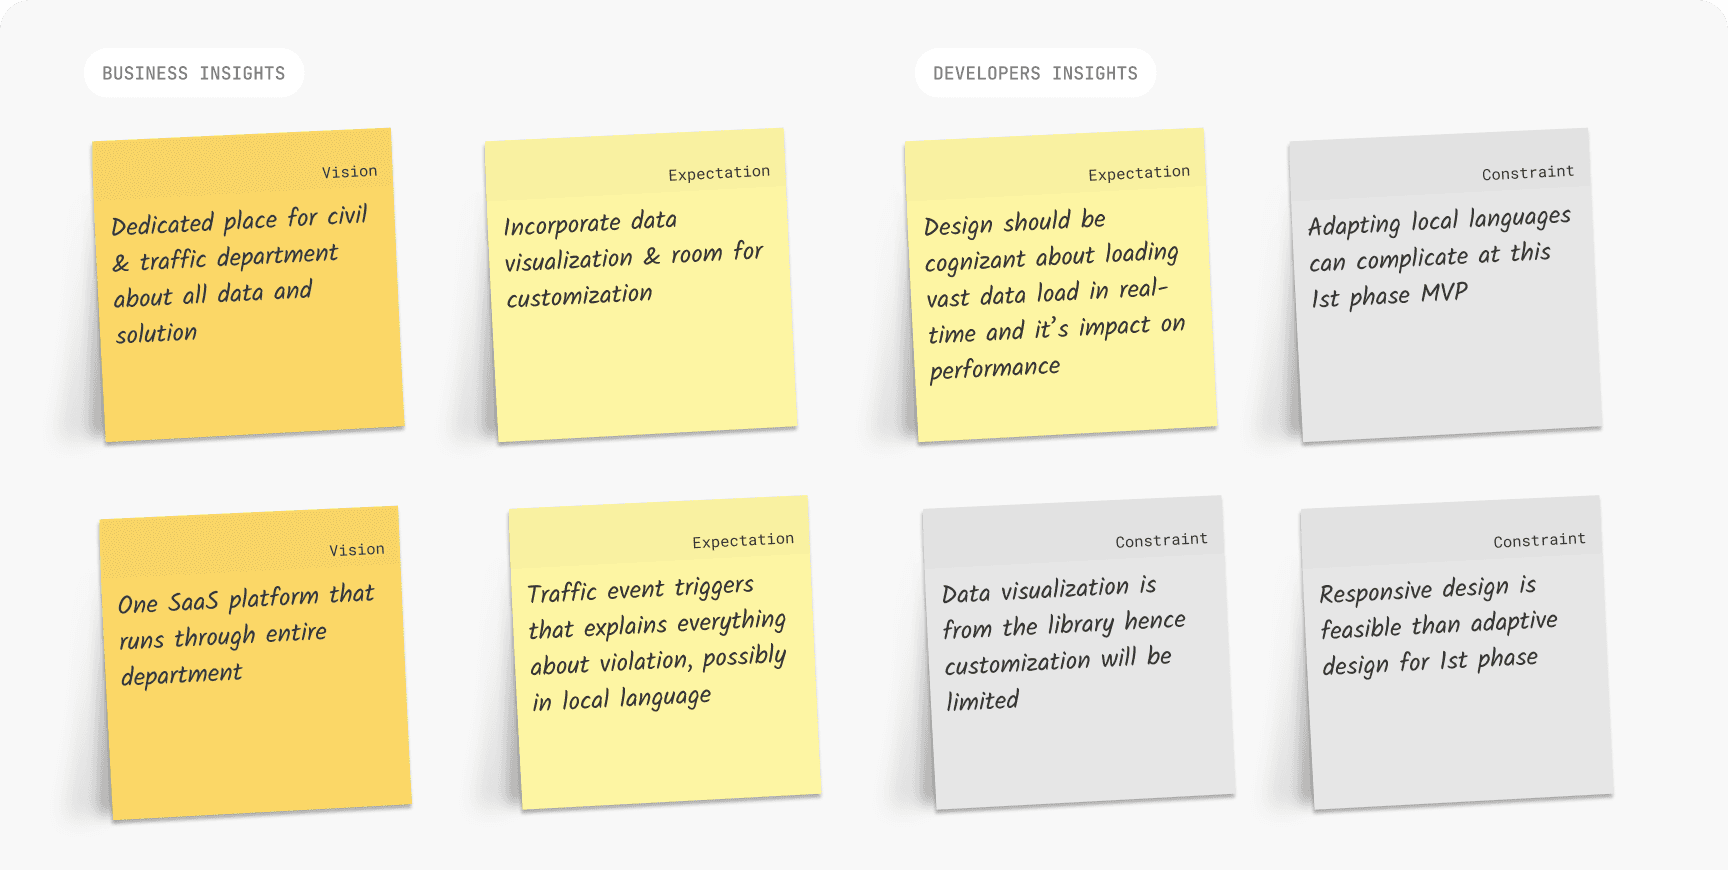
STAKEHOLDER RESEARCH
Understanding the expectation from stakeholder interview
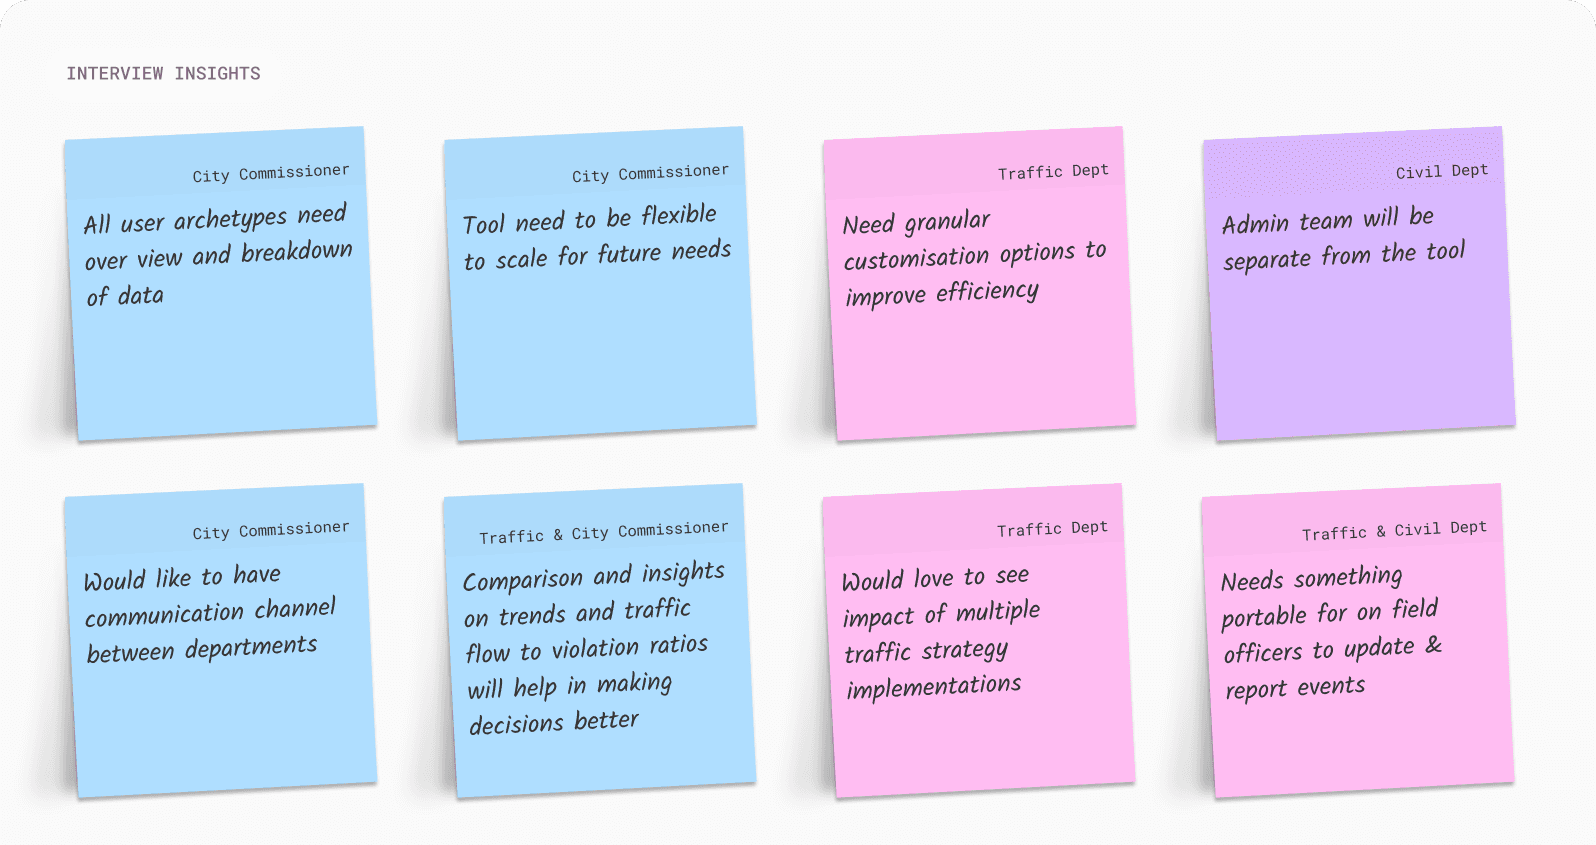
USER RESEARCH
Understanding the User
POLICE DEPARTMENT
Crime Analysts, Sub Inspectors
Focused on tracking vehicles associated with crimes, and identify the movements of suspicious vehicles with number plates, colors, and other characteristics.
TRAFFIC DEPARTMENT
Traffic Analysts, PI Traffic
Interested in monitoring real-time traffic flow patterns and identifying traffic violation trends, to optimize manpower deployment and improve public commuting experiences.
ADMINISTRATIVE
Smart City Commissionerate
Insights from user interview
GOALS
Understanding the business and user goal
BUSINESS GOALS
1
Expand to traffic management solutions market
2
Foster strategic partnerships with government
3
Increase brand visibility and reputation
USER GOALS
1
2
Optimize traffic flow with data-driven decisions
3
Ensure software is scalability to accommodate the evolving needs
DESIGN APPROACH
Setting the design principle
Transforming big data into actionable insights
Adaptive experience for diverse workflows
Minimize cognitive load and automate routine
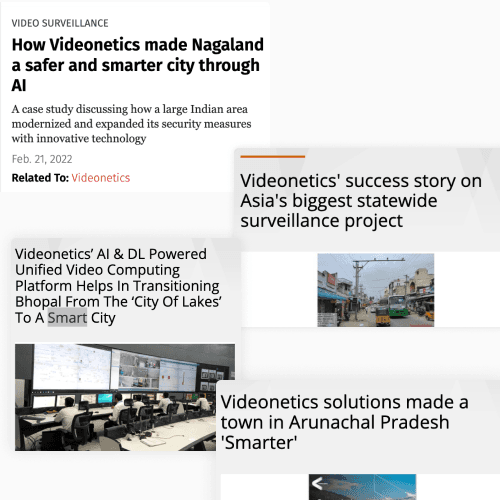
SECONDARY RESEARCH
Heuristics Evaluation and UX Audit
Identified critical areas for improvement in the prototype by assessing usability issues, information architecture breakdowns, and information segregation. This analysis ensured the final design aligned with user objectives and expectations, laying the groundwork for a more intuitive experience.

DESIGN
Wireframes
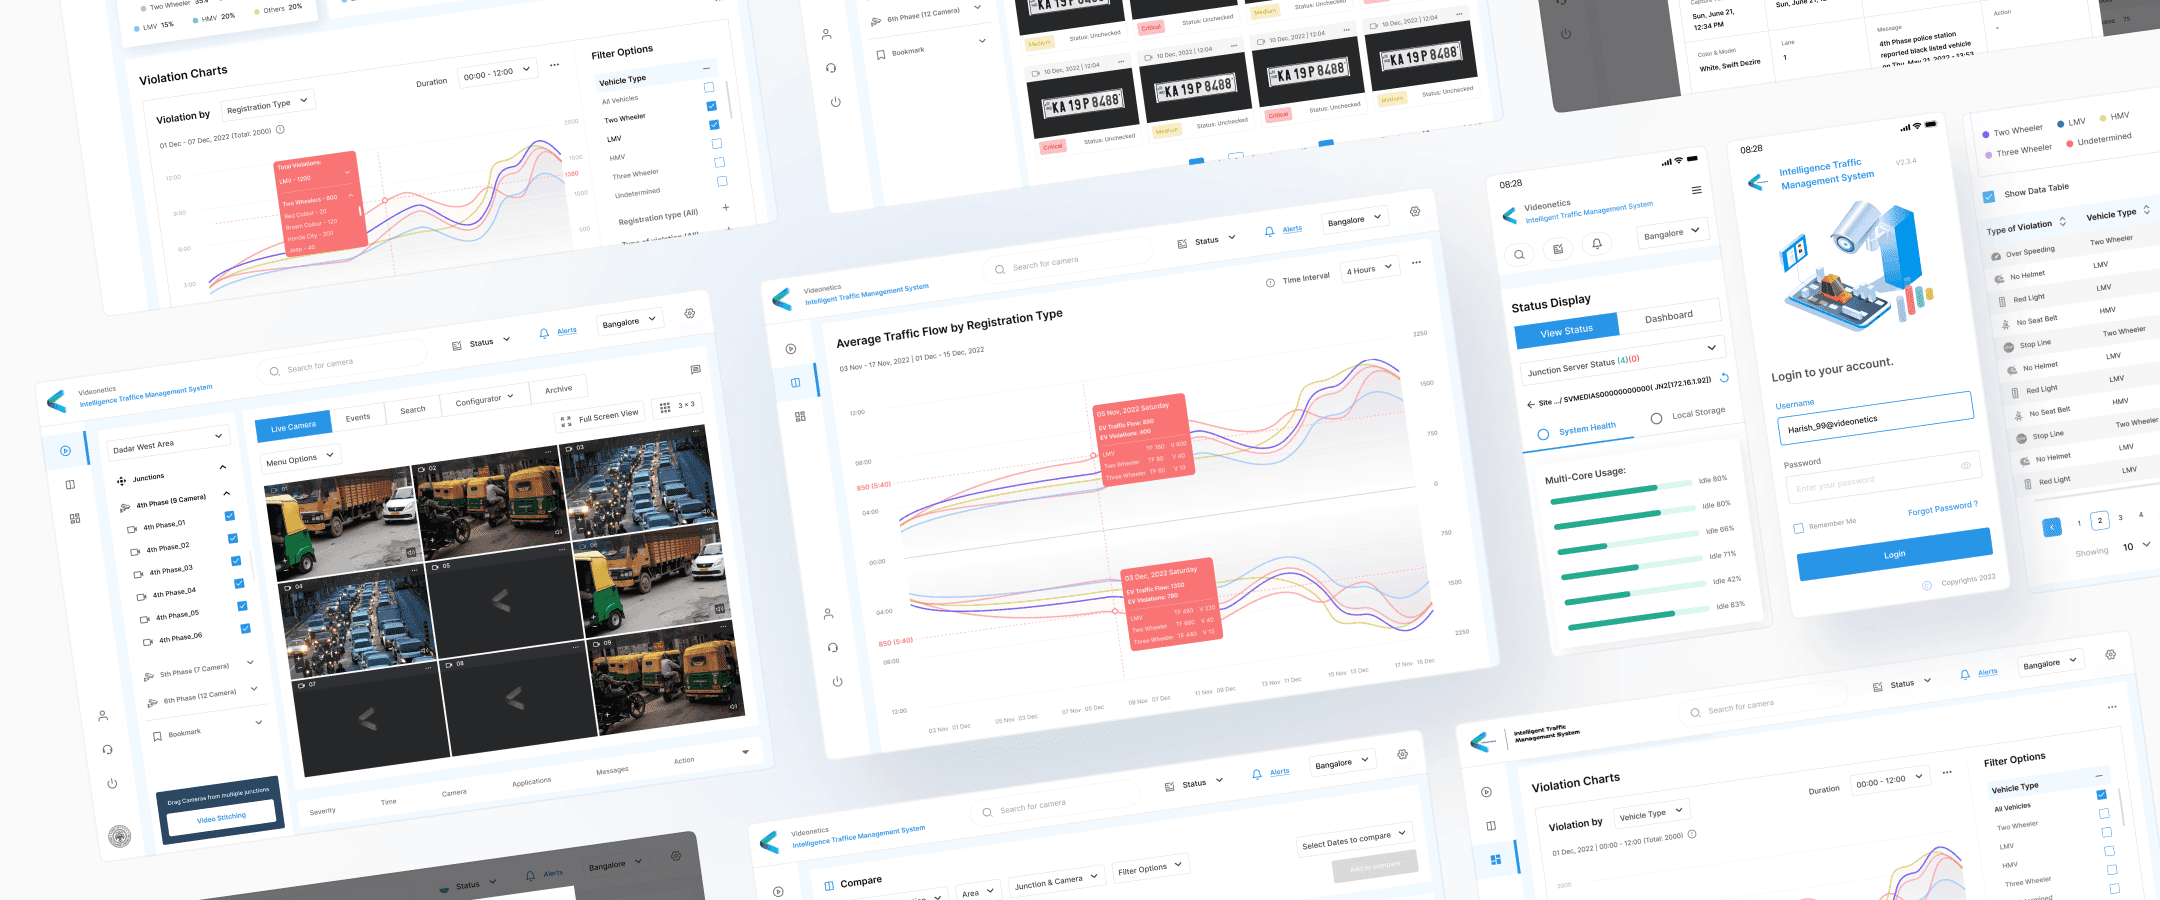
Final Designs

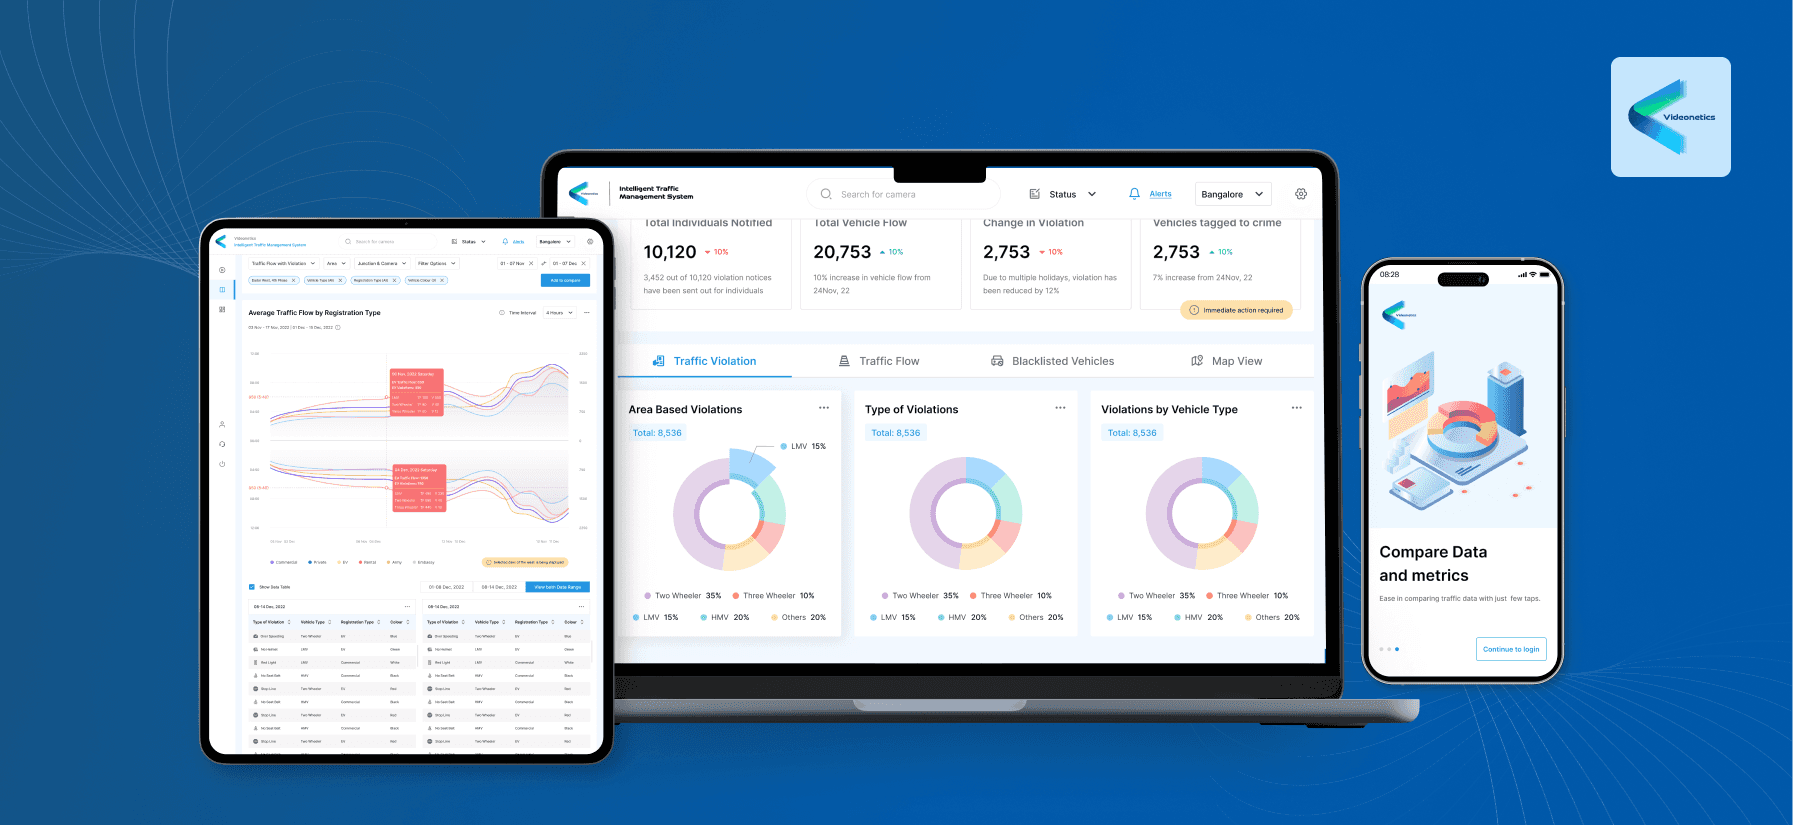
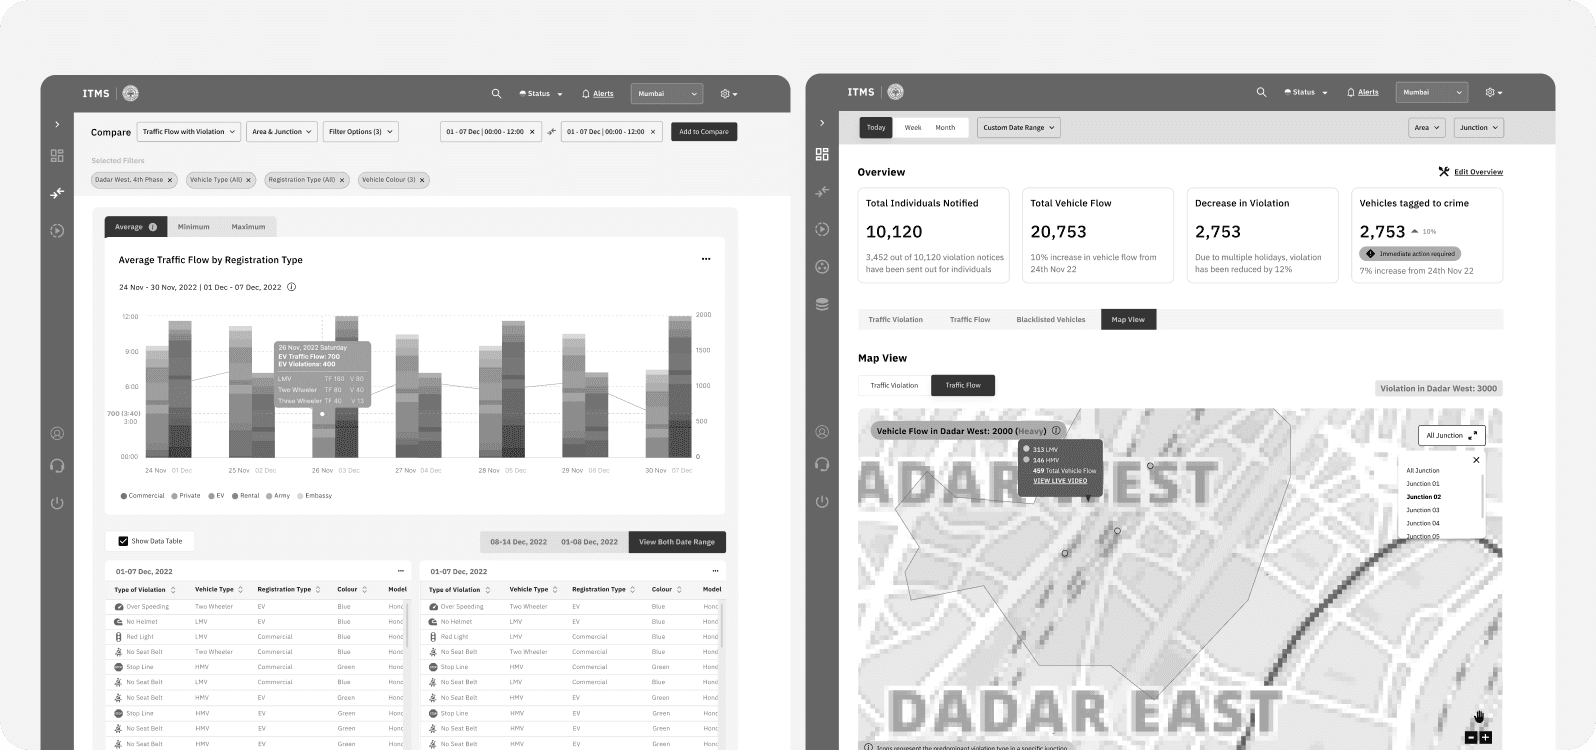
Comprehensive dashboard for data overview and analysis
Real-time video monitoring with enhanced search engine
Comparison charts to analyse trends and strategies
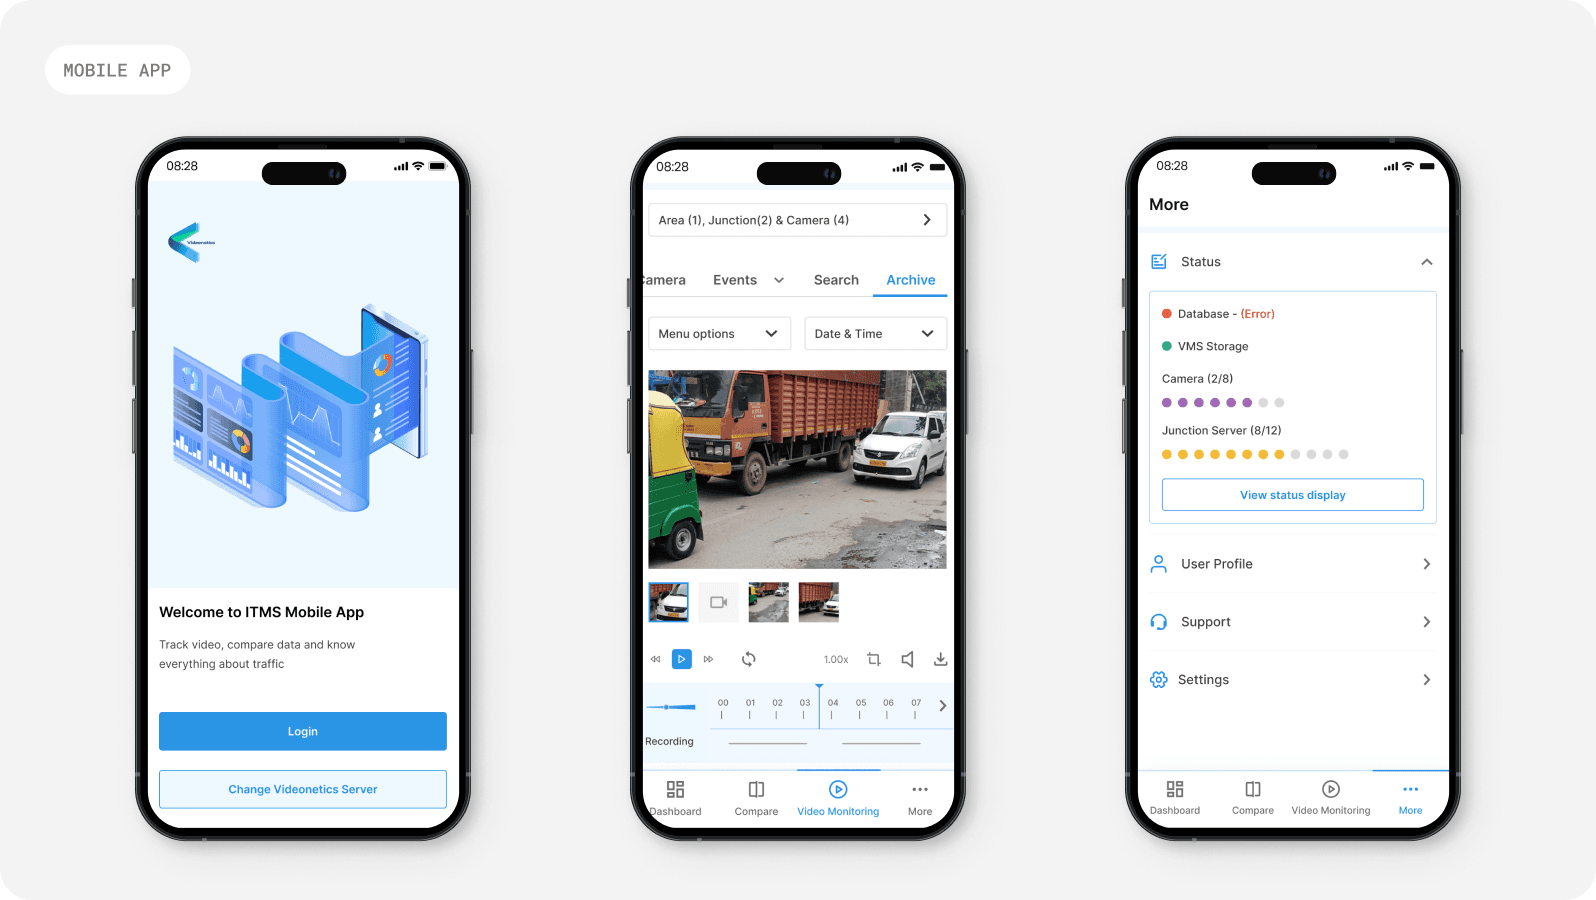
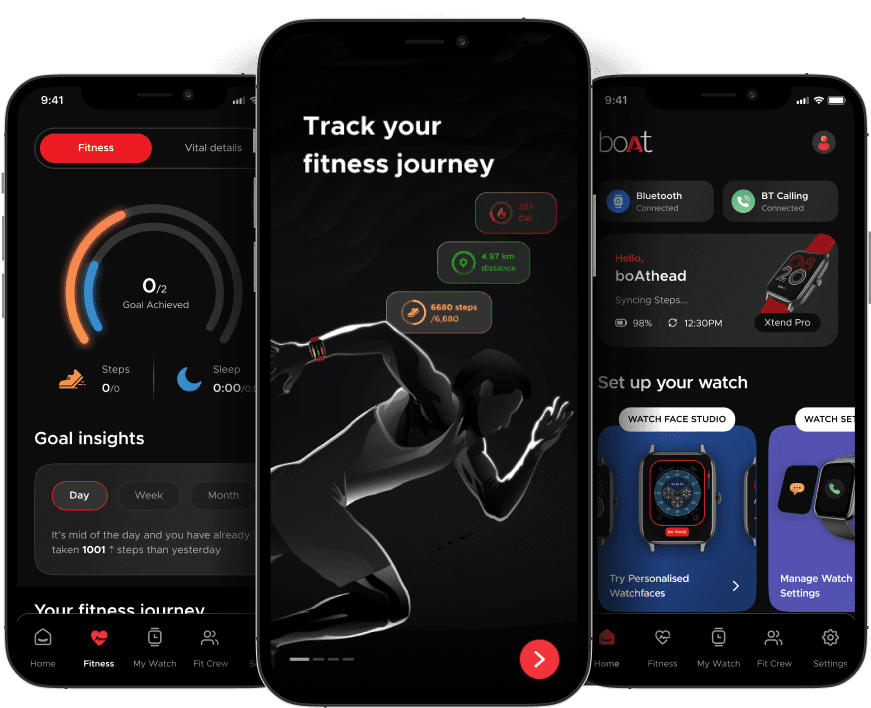
Mobile app for authorities deployed on field

Scalable Design System
We developed a robust and scalable design system that spans across both web app and mobile app platforms. This system was meticulously crafted to serves as a foundation for delivering a consistent, flexible, and scalable user experience and adapt to future software expansions.
Learnings
Prioritize user workflows
By understanding the tasks and workflows of traffic management authorities, we could design interfaces and features that assisted and streamlined their processes to boost productivity.
Designing to handle large volume of data
Strategic information architecture and wireframing ensured that the data loads quickly performance of the system is sublime.
Value of Agile Process
Iterative approach allowed us for continuous feedback and refinement throughout the project lifecycle & helped in delivery of MVPs enabling faster time-to-market.
Future Considerations
Full fledged configurator
Build admin portal to manage employees access to data based on their designation
System support
Provide constant support to authorities in event of failure